
1. General information
CANICA is a near infrared (NIR) imaging instrument available at the 2.1-m telescope of the Observatorio Astrofísico Guillermo Haro (OAGH) in Cananea, Sonora. It hosts a HAWAII detector, which is an array of 1024 x 1024 pixels. The camera has a focal reductor to give a final image scale of 0.32 arcsec/pixel and approximately a field of view of 5.5 arcmin on each side. The camera is commisioned in April 2002, and is the primary bright-time instrument at the observatory. The first priority of CANICA is to carry out a number of key scientific projects, for which the camera was acquired. This manual gives a brief outline on various aspects related to the instrument, which will of interest not only to the CANICA working group, but also to all future users.
2. Camera Description
Introduction The new CANICA camera is based on the 1K x 1K Rockwell Science Center HAWAII (HgCdTe Astronomical Wide Area Infrared Imaging) focal plane array and includes a cryostat with two 15-position filter wheels and a pupil mask. The excellent optical and throughput performances of the instrument promise to greatly enhance the near-infrared imaging capabilities of OAGH 2.1-m telescope. The pixel scale of 0.32''/pixel is used, leading to a total field-of-view of 3.6' x 3.6' on the sky. The main characteristics of the CANICA camera are summarized in the table below.
| Detector format | 1024 x 1024 |
| Detector material | HgCdTe |
| Spectral range | 0.85 - 2.40 µm |
| Plate scale | 0.32 ''/pixel |
| Pixel size | 18.5 µm / pixel |
| Total field of view | 5.5' x 5.5' |
| Operating temperature | 77 K |
| Readout noise |
~ 15 e-/pixel |
|
Gain |
2.35e-/ADU |
| Dark current | 0.02 e-/sec |
| Full well capacity | 45 000 ADU/110.000 e- |
| Linearity (4%) | 20 000 ADU/50.000 e- |
| Mean quantum efficiency (detector only) |
76 % (for 99.5% of pixels) |
| Minimum integration time |
0.1 sec (with shutter); 1 sec (in staring mode) |
| Maximum integration time | 1 hour (not recommanded) |
| Readout time (full frame) | 1 second |
CANICA main characteristics Cryostat Assembly The cryostat contains the single fixed reimaging optics, two 15-position filter wheels, corresponding drive motors and position encoders, the FPA, temperature sensors, and electrical connections. The cryostat itself is a custom design from Infrared Laboratories, with a single 8.5 liters cold tank and a surrounding radiation shield. Measured hold times have exceeded 48 hours in a side-looking configuration. Operating temperature is 77 to 80K. The cryostat is internally gold plated to reduce surface emissivity and increase vacuum integrity. All internal surfaces providing optical baffling are black painted using vacuum-qualified paint. The cryostat contains a carbon getter with its own thermal circuit-breaker protected getter heating element and temperature sensing elements. The focal plane mount is on a similar yet completely independent thermal stage. Strict attention was paid to dewar materials and construction to maintain low outgassing and high vacuum. Optics The optics accept a f/12 beam over an unvignetted field of 4.0' x 4.0' for direct imaging at Cassegrain focus of the 2.1-m telescope of the OAGH. The fixed optical design reimages the input beam at f/6 on the FPA, providing a magnification ratio of 2.0:1.0. This yields a 0.32''/pixel scale. . All optical surfaces are anti-reflection coated. A cold stop is placed at the pupil image. The integrated transmission of the CANICA camera optics (without the filters) is designed to be greater than 85% for all wavelengths in the 0.75 to 2.5 µm spectral range.
Detector
CANICA hosts Rockwell HAWAII array as the science grade array. This array has a mean QE of 76% for 99.5% of the array. The mean dark current is 0.04 e-/sec.
Here is a dark map and here is a flat field as received from Rockwell.
Acquisition system and user interface
CANICA is driven by a second generation San Diego State University (SDSU) CCD controller. The total detector readout and delivery time is 1 second.
The aquisition computer provides the observer with a user interface based on Java, through which they configure the camera, control the data acquisition, monitor the data storage and do some pre-processing, using IRAF which is available in the same computer. The aquisition program uses almost all of the CPU time every time a new image is written into the disk, and hence it is not recommended to use the computer when the exposure time is short (1 minute or less).
Filters
CANICA contains two filter wheels, each with a capacity for 15 filters. Filter Database and their detailed characteristics can be retrieved here.
| Position | Wheel 1 | Wheel 2 | ||
|---|---|---|---|---|
| L/dL | Filter_Name | L/dL | Filter_Name | |
| 1 | Dark | Dark | 1.246/0.163 | J |
| 2 | 2.248/0.036 | H2,2-1 | 1.633/0.296 | H |
| 3 | 2.178/0.025 | H2,1-0 z | 2.119/0.351 | K |
| 4 | 1.316/0.020 | Pa Beta z | 1.572/0.02 | H-cont |
| 5 | 1.283/0.021 | Pa Beta | 1.641/0.03 | FeII |
| 6 | Empty | Empty | 1.688/0.017 | FeII z |
| 7 | 1.026/0.049 | Z | 2.059/0.030 | He1_B (HeII) |
| 8 | 1.077/0.019 | He1_A | 2.189/0.032 | He1_C (HeII) |
| 9 | 1.096/0.017 | Pa Gam | 2.269/0.030 | K-cont |
| 10 | Empty | Empty | 2.168/0.03 | Br Gam |
| 11 | Empty | Empty | 2.224/0.024 | Br Gam z |
| 12 | 2.107/0.033 | He2,1-0 | 1.198/0.009 | J-cont |
| 13 | Empty | Empty | 2.294/0.034 | CO 2-0 |
| 14 | HK notch | HK notch | 2.308/0.025 | H2,2-1 z |
| 15 | Empty | Empty | Empty | Empty |
3. First light and Other images
CANICA saw first light at the telescope on 22 April 2002. Here are some images taken in the first run.
K-band image of a Starburst galaxy M82 with CANICA without sky subtraction.
A composite color image obtained by processing and combining J H & K filter images of M82 (scaled to see both inner and outer parts)
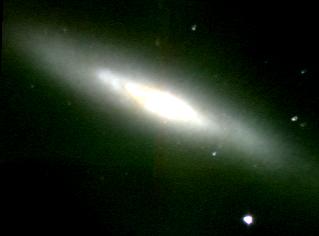
KHJ color composite from a deeper exposure in Mar 2004.
4. Performance
4.1 Limiting Magnitude Estimates
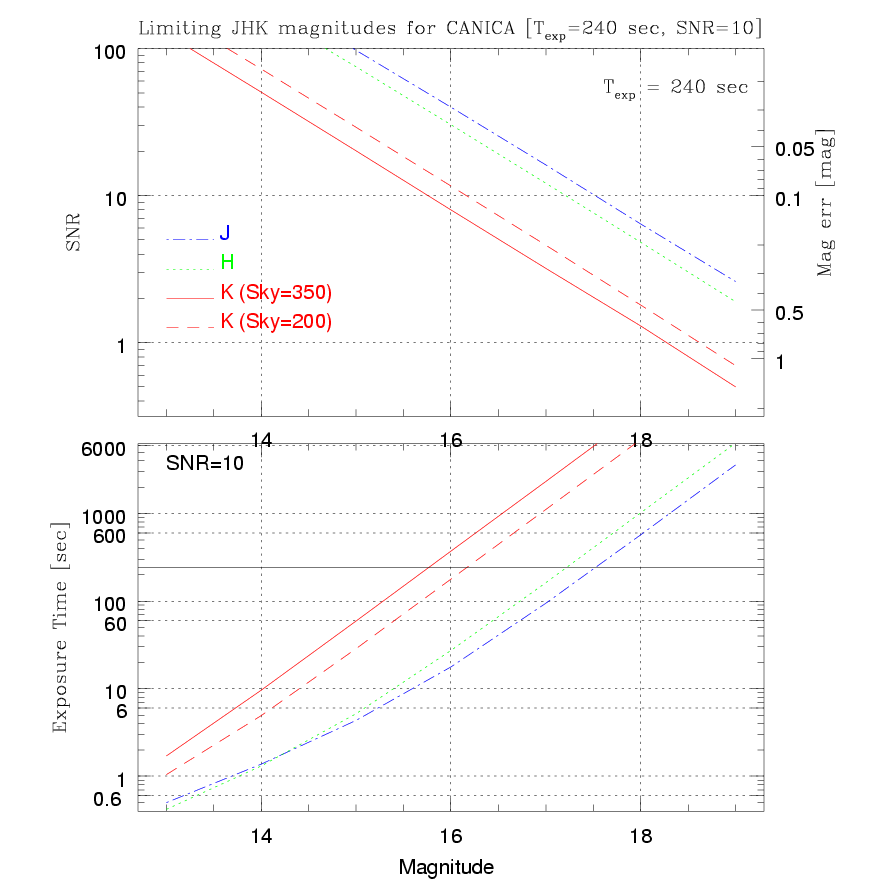
Plot to estimate Limiting Magnitudes and exposure times in J, H and K bands for CANICA at the 2.1-m telescope of the OAGH. The top panel displays the Signal-Noice-Ratio (SNR) as a function of magnitude expected for a single or multiple exposures with a total integration time of 240 seconds. On the Right hand side axis, errors on the estimated magnitudes are given. In the bottom panel, total exposure time required to reach a SNR=10 (i.e. m_err=0.10 mag) is plotted as a function of magnitude. In both panels, K-band limits were calculated for two values of sky values (Normal=350 counts/s and Good=200 counts/sec). The limititing magnitudes (SNR=10) for total exposure time of 240 secs are J=17.5, H=17.2, K=16.0+/-0.2. These values could be bettered to J=19.0, H=18.8, K=17.6+/-0.2 if the exposure time is 1 Hour. These calculations are based on the following characteristics of the detector/instrument: Readout noise = 15 electrons (6 counts), dark=0.02/sec, pixel scale=0.32 arcsec/pixel, pixels/star=55.0, seeing: 2.0 airmass: 1.20. The values below correspond to the March 2003 run.
| Filter | Zeropoint | sky/sec | sky [mag/arcsec²] |
|---|---|---|---|
| J | 20.25 | 20 | 14.5 |
| H | 20.50 | 60 | 13.6 |
| K | 20.00 | 350 | 11.2 |
| K | 20.00 | 200 | 12.0 |
The intrinsic photometric error with CANICA is found to be around 0.05 magnitude at best, and can reach 0.20 if proper care is not taken in chosing the aperture. So there is no gain in observing to get SNR > 20. The observations are background limited, and hence SNR improves as SQRT(Texp). In otherwords, to go down deeper by 1 magnitude, the exposure time should be increased by a factor of 6.
Zeropoints for Oct12/13 2003 (after aluminization of the Mirror)
| Filter | Zeropoint | sky/sec | sky [mag/arcsec²] |
|---|---|---|---|
| J | 20.70 | 30 | 14.5 |
| H | 20.79 | 130 | 13.0 |
| K | 20.43 | 350 | 11.6 |
So zeropints are roughly 0.35 magnitude fainter, implying a gain of 40% in exposure time.
4.2 Observed Errors on Magnitudes and Repeatability
Stellar fields are normally observed by a sequence wherein stars are moved from one quadrant to another. These observations are used to estimate zeropoints and errors and repeatability of magnitudes. The method followed is described, using the K-band observations of AS37 field on Oct 13/14. The observations were repeated 11 times in the sequence, each of exposure 10 sec. Magnitudes of 12 stars on each of these frames were measured (m_K) to assess the repeatabilty of the magnitudes. In addition magnitudes were measured in a combined frame (). The brightest two stars in the field are standards. The zeropoint is obtained using the brightest star (AS37-0), and is used to transform the instrumental magnitudes of other stars.
4.2.1 Chosing the right radius
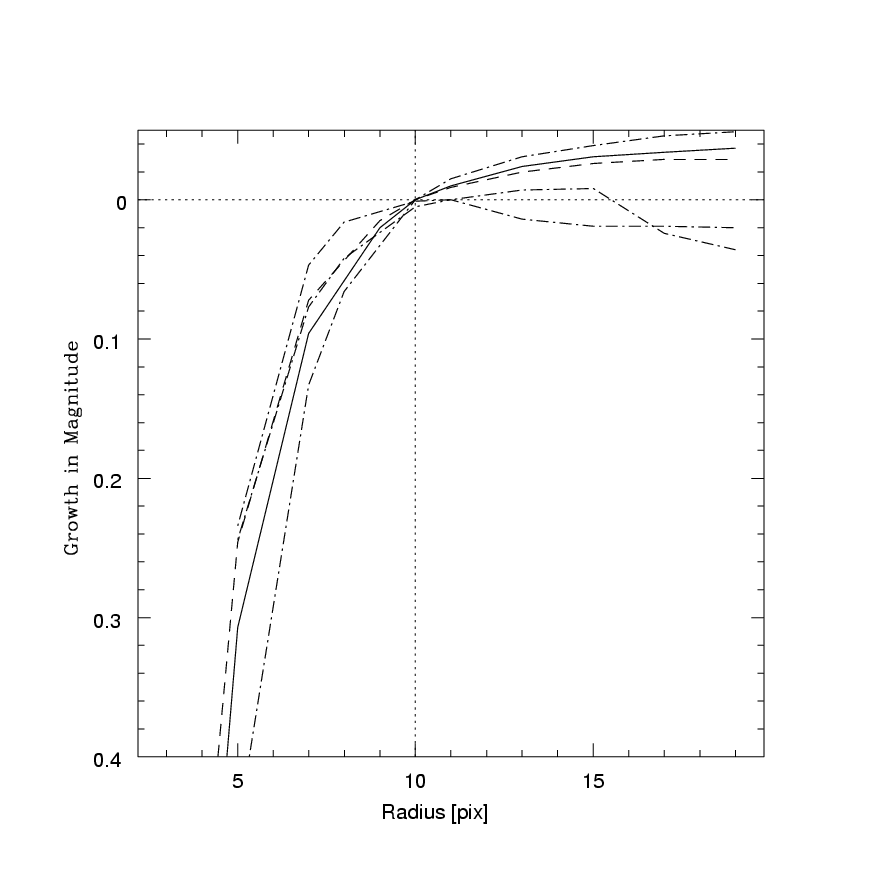
The most important task in extracting stellar magnitudes is fixing the smallest radius, which includes almost the entire flux from stars. The task becomes difficult for fainter stars, as the errors in the sky estimation can introduce large errors in the magnitude. The figure below illustrates growth profiles for 5 stars, spanning magnitude range of 5 mag (K=8.6 to 13.6). The curves are normalized such that at a radius of 10 pixels (3.2 arcsec), magnitude is zero. The flux outside this radius is only 3% for the brightest two stars (solid and dashed lines respectively). Assuming that all the stars have similar Point Spread Function (PSF), the flux outside a radius of 10 pixel should be 3% for even the fainter stars. Thus for all the stars, magnitudes are measured at radius=10 pixel, and then 0.03 magnitude is subtracted to get the final magnitudes.
Repeatability of the magnitude measurements can be checked by comparing the magnitudes of the same star in different frames of a sequence. In the following figure, the top panels show this as a function of radius distance from the center of chip (left) and magnitude (right). The middle left panel shows the magnitude in the combined frame, and the bottom panels show the magnitude differential from the growth curve for each star as a function of radius distance from the center of chip (left) and magnitude (right). In the middle right panel, magnitude errors based on the noise statistics are plotted as a function of magnitude.

From this figure, it can be concluded that:
- the repeatability of the magnitudes (for 10 sec exposures ) is better than 0.10 mag for stars brighter than K=12 mag (rms error=0.05). For stars with K=14, the rms error is around 0.15 mag (expected error is 0.1 mag);
- within a radius of 500 pixels, magnitudes errors are not dependent on the radial distance;
- magnitude measurements for stars fainter than 11 mag can be vastly improved if they are measured at radius=10 pixels.
Similar plots for Oct13_14_2003 H AS37 | Oct13_14_2003 J AS37 | Mar22_23_2003 K AS19
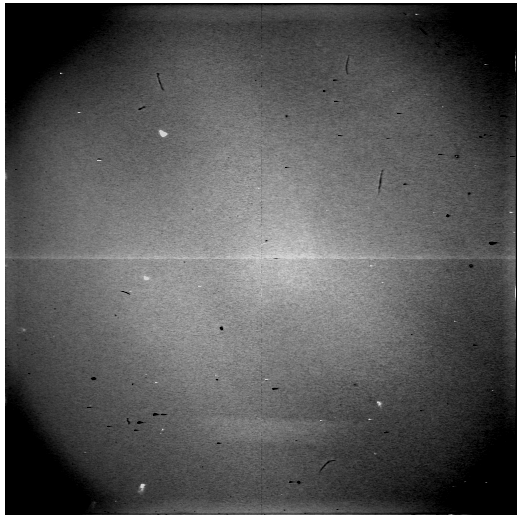
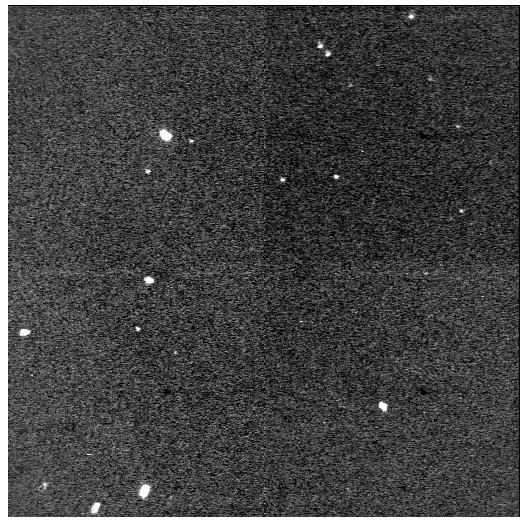
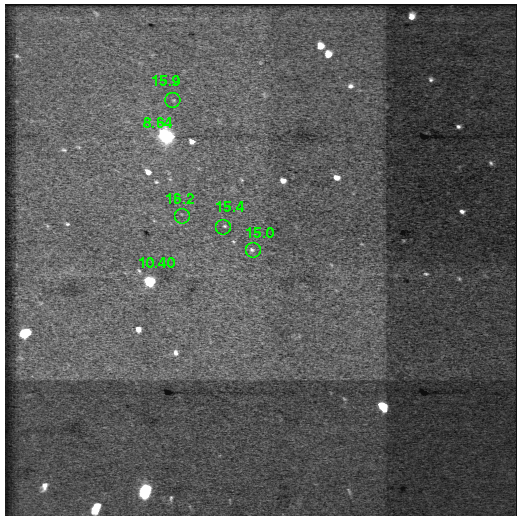
4.3 Example of a raw and sky subtracted images (AS37 K 10 sec x 11 Oct 13/14 2003)
|
Raw Imagen |
Sky image (378.8 +/- 11.19) |
|
Sky subtracted image (rms=1.335) |
Sum of 11 sky subtracted images (rms=0.263) |
 |
 |
 |
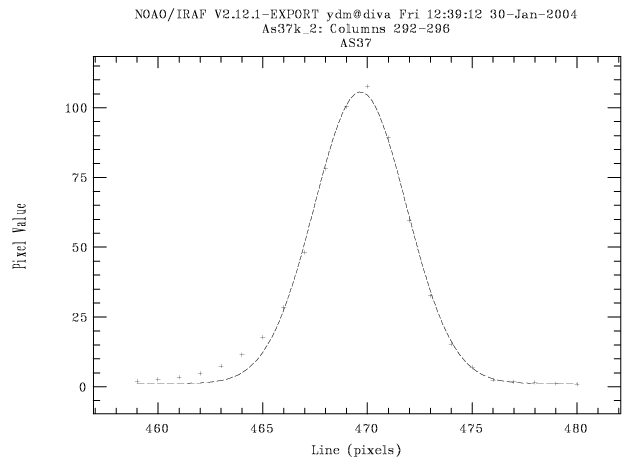
In the combined image, K-band magnitudes of some of the stars are noted. Stars as faint as m_k=16.2 can be detected on this image. Guassian fit to m_k=10.4 star in the combined image along x and y directions. Fitted FWHM_x=6.2. and FWHM_y = 5.2. Contours of the same star wherein we can see the 2 dimensional structure near the center of the chip |

4.4 Linearity Check in different Quadrants and Filters
Linearity of the detector in the four quadrants in J and H filters were checked using dome flat field frames of exposure times ranging from 1 to 40 secs. The resulting data are displayed without bias subtraction below. Bias is around 4500, and hence the linearity is 1, 2, 3 and 4 perecents at 5000, 9000, 13000 and 18000 counts, respectively. The non-linearity correction is practically the same in the four quadrants and different filters.
5. Instructions for observers
Data acquisition with CANICA is done under Lynux enviroment. Login and passwords are available with technical personel at the observatory, who will also switch on and setup the instrument. Before starting observations, observer should make sure the following things:
-
Noise level:
The readout electronics is very sensitive to interference with the AC power line. So all the power lines in the telescope floor need to be properly shielded. Normally the technical personel will make sure that this is done. Thanks to the re-wiring of the telescope building carried out over the last one year, the intereference noise levels have been reduced to the level of readout noise. Technical staff will check this every night by taking a one second exposure with a "Dark" filter. Resulting image should not have rms in a 100x100 pixel box, more than 10 counts/pixel/sec.
-
Orientation of the Camera:
The default orientation is North up, East right. However there will be a few degrees error in the set up. So the observers have to make sure that the East-West axis is along the lines by moving a star on the detector by changing only RA. It is possible to align within 2 pixels (i.e. 0.1 deg).
-
Focus:
The image shape depends to some extent on the gate voltage. The best voltage has been selected so as to get roundish images. However, images are still slightly elongated along the x-axis. Typical FWHM of the profiles are 5 x 4 arcsec along X and Y-axes respectively.
-
Image centering:
Although the camera has a field of view of 5.5 arcmin, it is advisable to use the central 4 arcmin for accurate observations. This is basically because of vignetting and coma at the edges of the detector.
-
Observational Script:
The object-sky observing sequence is passed to the telescope through a Java script. Click here for an example script for observing the standard field AS40, by moving the star from one quadrant to another.
-
Flat filed images:
Getting a good flat field image is tricky in infrared images, due to the difficulty in getting a spacially uniform radiation field at the detector. The best strategy is to take dawn/dusk sky exposures so as to have around 10000 counts, preferably in a single exposure of 1 sec. Then when the light levels are low, take another set of sky exposures with the same 1 sec exposure. Subtracting the average frame of the latter set from the former results in a reasonably good flat field frame. It is recommended to repeat this in every filter in which observations are being carried out. Illuminated Dome flats may be useful in J and H bands, but not much in the K-band.
-
Standards:
Use the northern JHK standard stars of Hunt et al. (1998)[AJ, 115, 2594]
6. Image processing pipeline
A pipeline to reduce images obtained by CANICA has been developed locally under the IRAF enviroment. The pipeline automatically detects sky frames from object frames in a sequence, prepares the sky frames, subtract sky from the object frames, mutually aligns the object frames, before combining them to produce a final image. A detailed instruction on the pipeline can be found here.
7. Science Programs
Luis Carrasco (carrasco@inaoep.mx) is the Principal Investigator of the CANICA project. If you are interested in observing with this instrument, please contact him. Here is a list of some of the key science programs being currently carried out with CANICA:
High-z Quasars from the Palomar-Quest Survey: Probes of the Early Structure Formation and Reionization (L. Carrasco)
Formation and Evolution of HII galaxies (E. Recillas)
Study of the NIR morphology in galaxies with extremely strong bars (L. Athanosoula)
Eficiencia de formación estelar en nubes moleculares (A. Luna)
8. Acknowledgements
CANICA project is funded by the CONACyT grant G28586-E (P.I. Luis Carrasco)
Technical support is given by:
Gustavo Escobedo (gescobe@inaoep.mx) and Edgar Castillo (cade@inaoec.mx)
Technical report:
The initial testing of the Camera electronics and control software development was carried out by Oscar Hernandez Utrera as part of his Master's thesis (INAOE 2002) titled "Electronica de lectura y Software de Control para un detector Infrarrojo HAWAII". The details of the electronics of the Camera and an intermediate level camera control software can be found in this tesis.
The acquisition software was developed by Luis David López Gutíerrez ( Technical report No. CCC-04-003).
Several current and past members of the Institute participated in testing and observations in the early part of the project, which includes:
Esperanza Carrasco (bec@inaoep.mx)
Omar López-Cruz (omarlx@inaoep.mx)
Divakara Mayya (ydm@inaoep.mx)
Manolis Plionis(mplionis@inaoep.mx)
Elsa Recillas (elsare@inaoep.mx)
T.N. Rengarajan (renga@inaoep.mx)
Diego Malquori (malquori@inaoep.mx)
Nelson Vera Villamizar (nelson@inaoep.mx)
Dirección: Luis Enrique Erro # 1, Tonantzintla, Puebla, Mexico C.P. 72840 Teléfono: (222) 266.31.00 Contacto: difusion@inaoep.mx
Esta obra está licenciada bajo una Licencia Creative Commons Atribución-No Comercial-Sin Obras Derivadas 2.5 México
